VICTOR KIMEU
PROFESSIONAL DATA ANALYST
I am an analyst with the ability to tell stories and build insights visualization using large datasets. I am able to draw insights from various database and dataset by working with tools such as MICROSOFT EXCEL and SQL for Data retrieval, querying and clean-up while using python and R to derive key market insights and trends. Later , I visualize the output using Power BI, Tableau, and Qlik.
let's connect! Hit any of the buttons below.
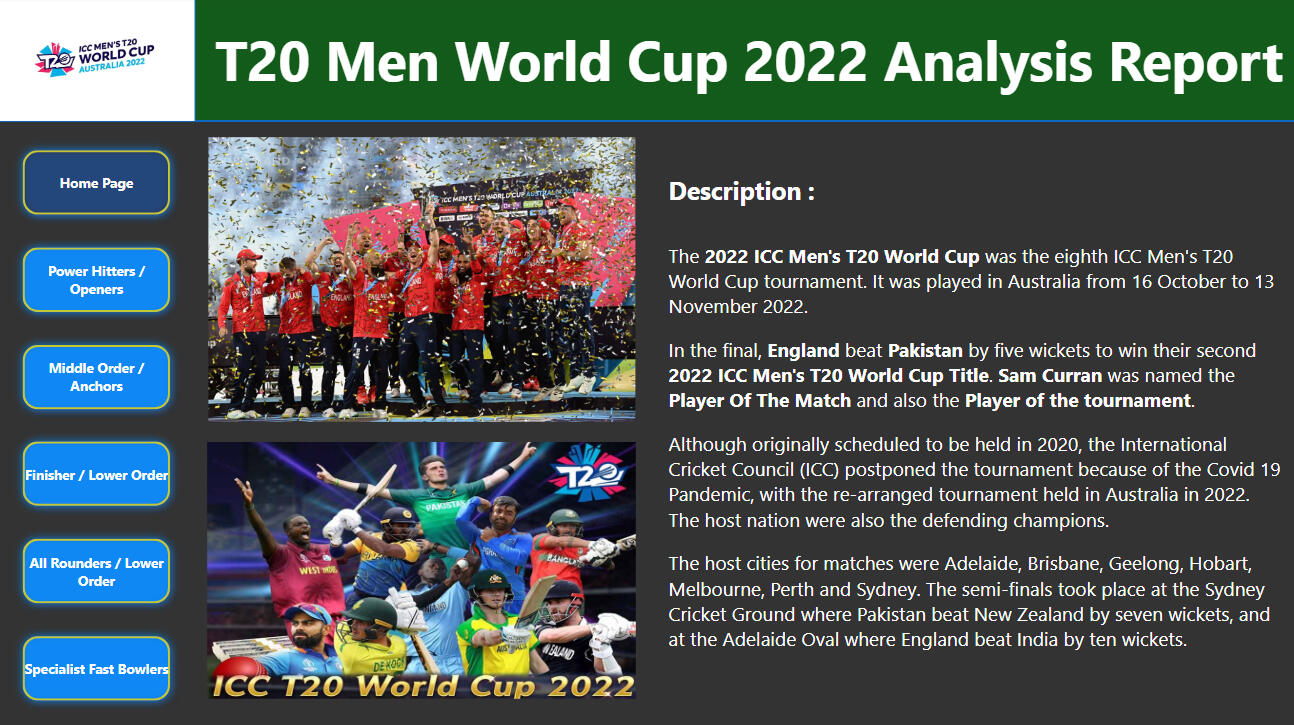
Text Devised a Power BI report by extracting, cleansing, and transforming data using Python Pandas to discern the top 11 players for a T20 cricket team, while also evaluating diverse player performance metrics.
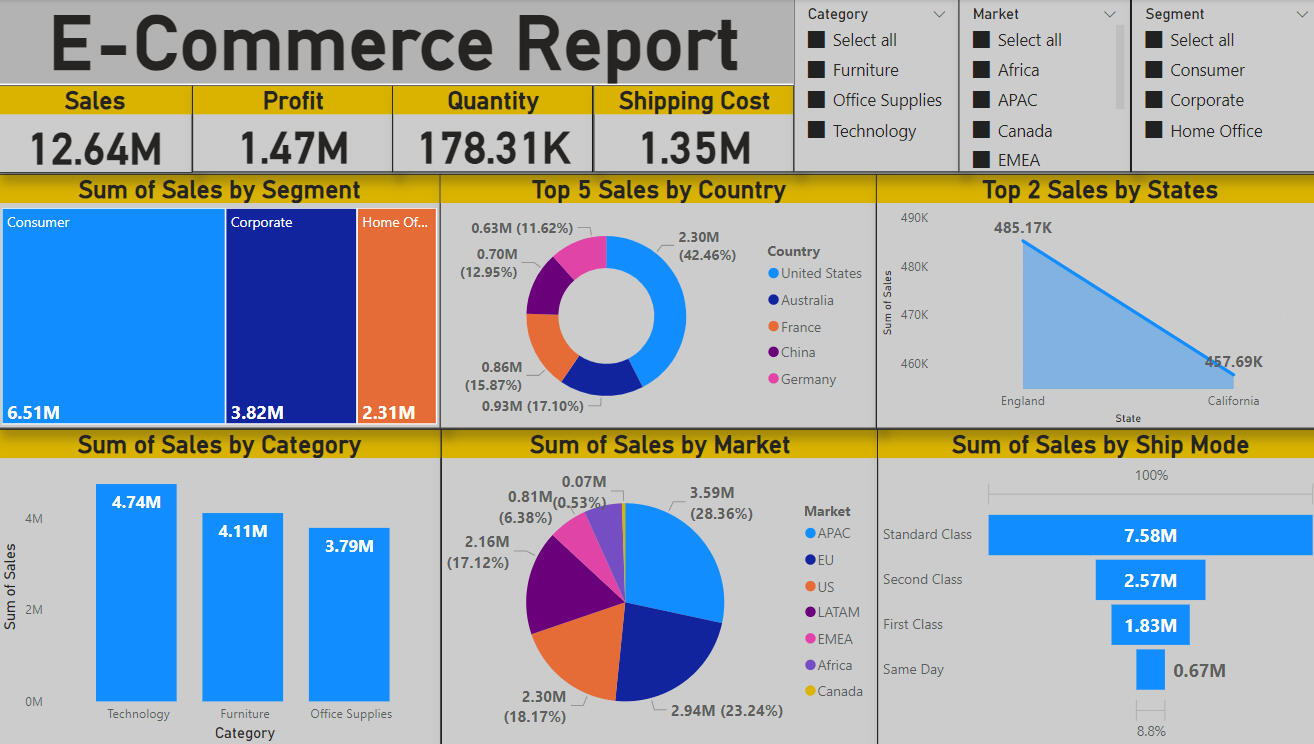
TexUnveiled sales trends: tech products dominated, USA led in sales contribution, and standard class shipments prevailed, alongside discovering top sales by country, segment, market, and shipment mode.t
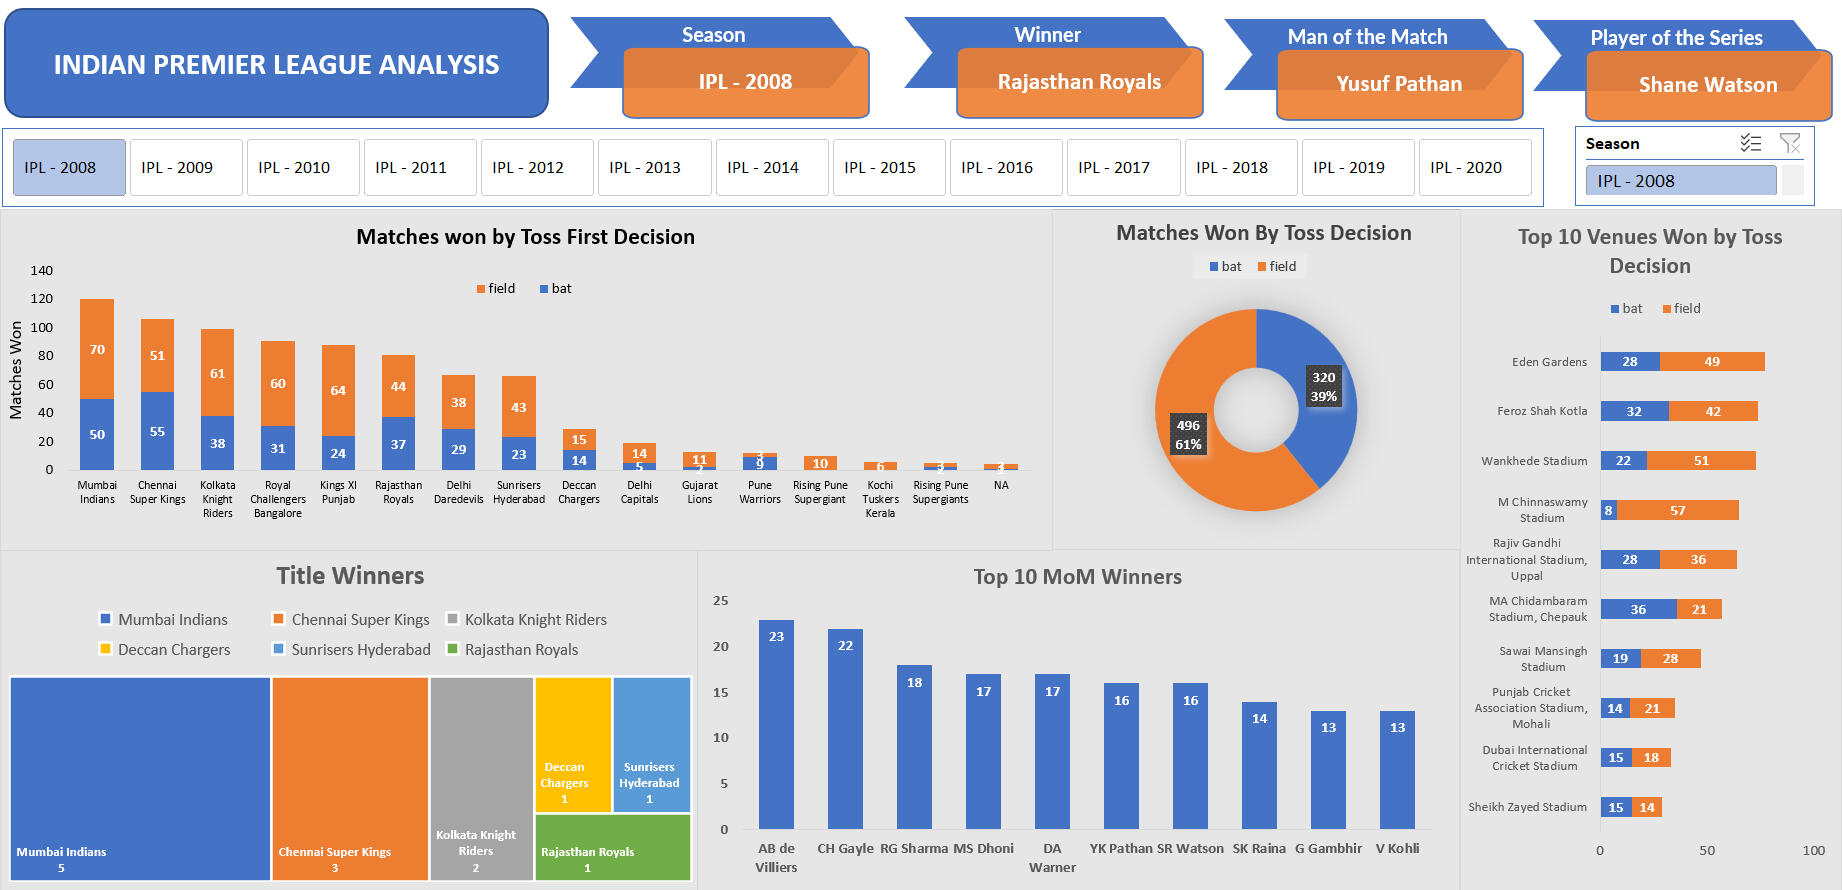
TextMined comprehensive IPL cricket data from 2008 to 2020, featuring tailored awards like Man of the Match, Man of the Season, and Season Winners, expertly cleansing the dataset in Excel before crafting an elaborate Excel dashboard. Leveraged pivot tables to curate an array of charts – from donut and column charts to bar and area charts, along with diverse KPIs.
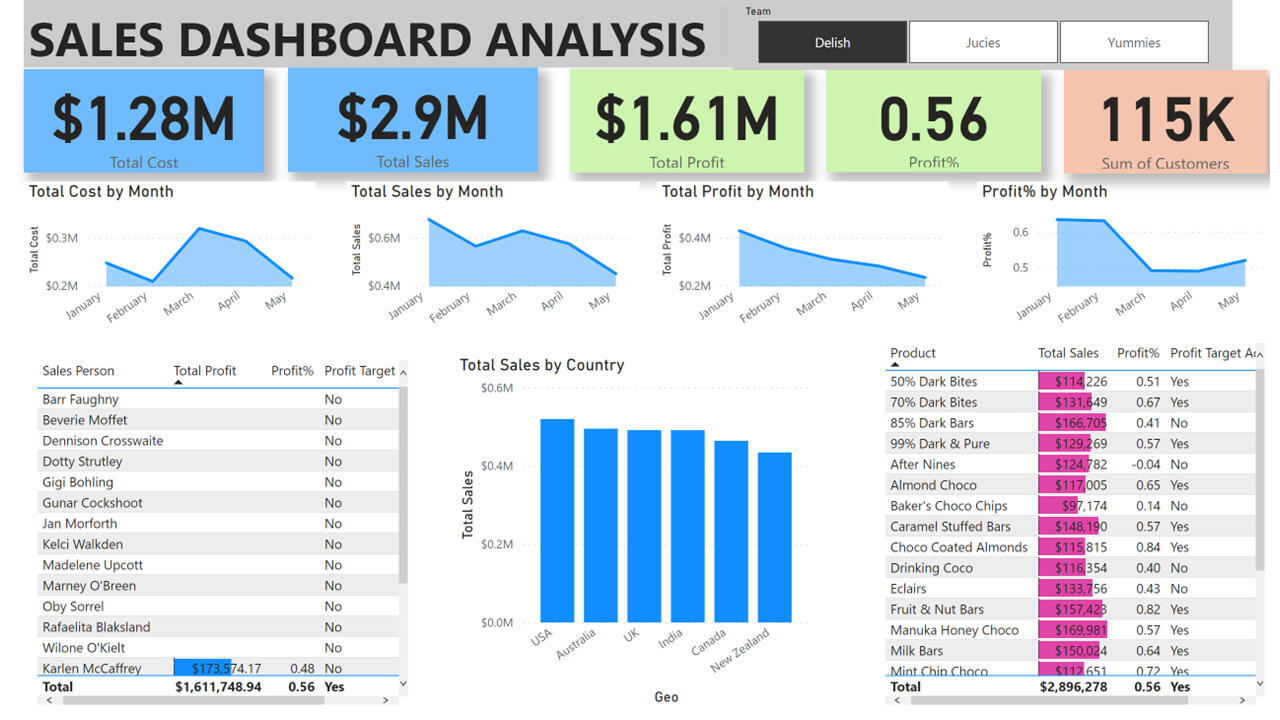
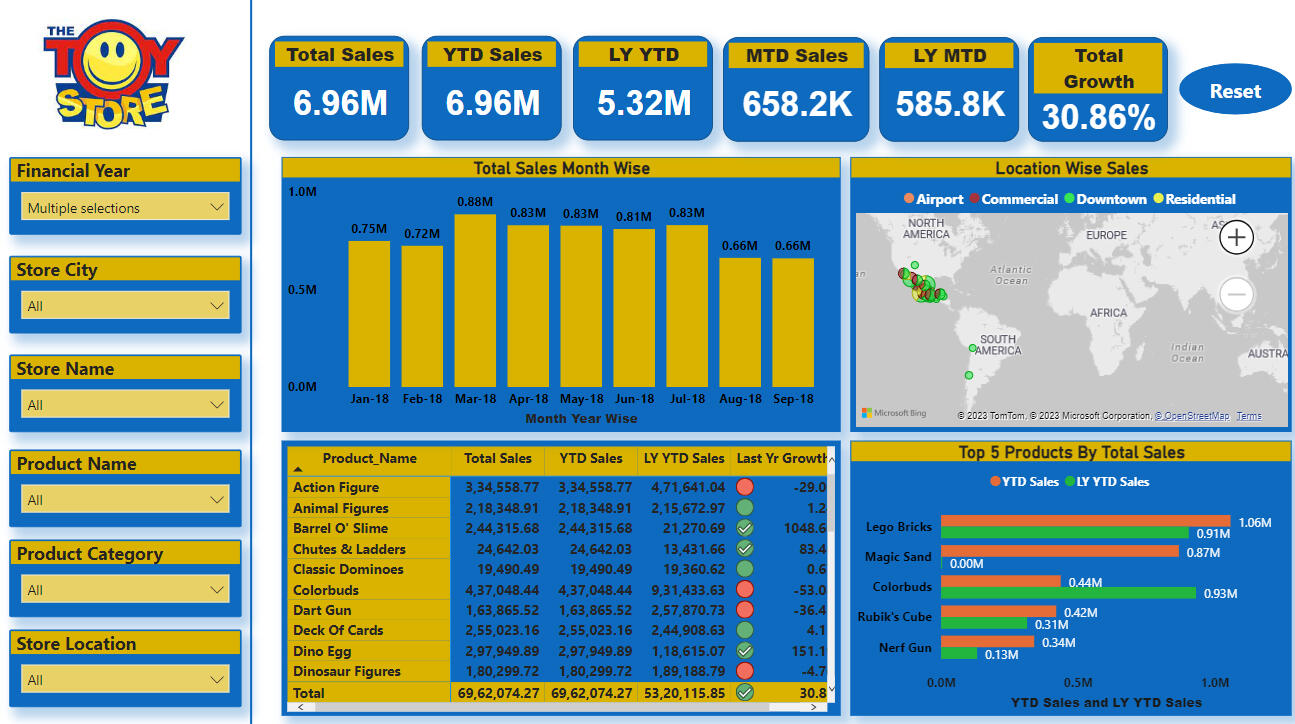
TextLeveraged Kaggle datasets to create dynamic Power BI dashboards, employing DAX queries and diverse visualizations for robust data analysis, driving proactive sales strategies and informed decision-making.
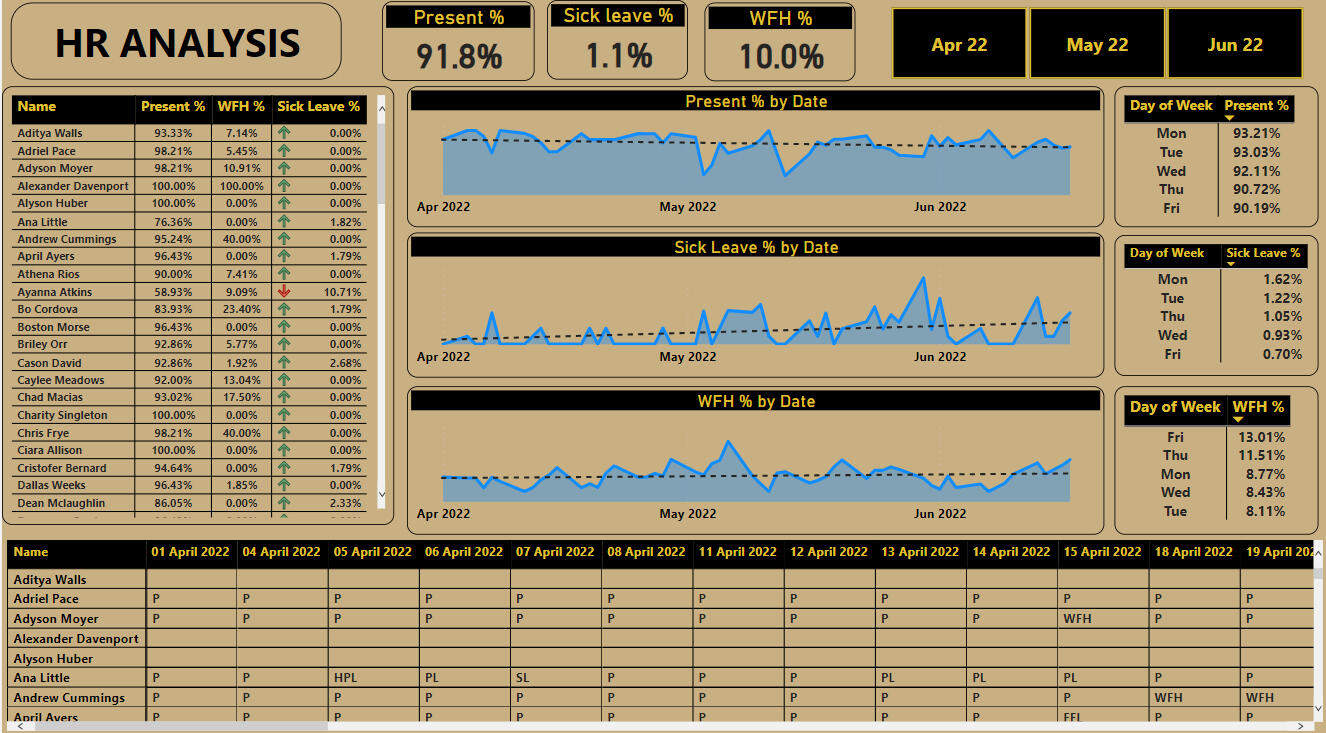
TeTransformed workforce insights into dynamic Power BI charts, unveiling trends of increased sick leaves and remote work, showcasing a 93% peak in on-site presence on Mondays while Fridays witness a 13% surge in remote work adoption.xt
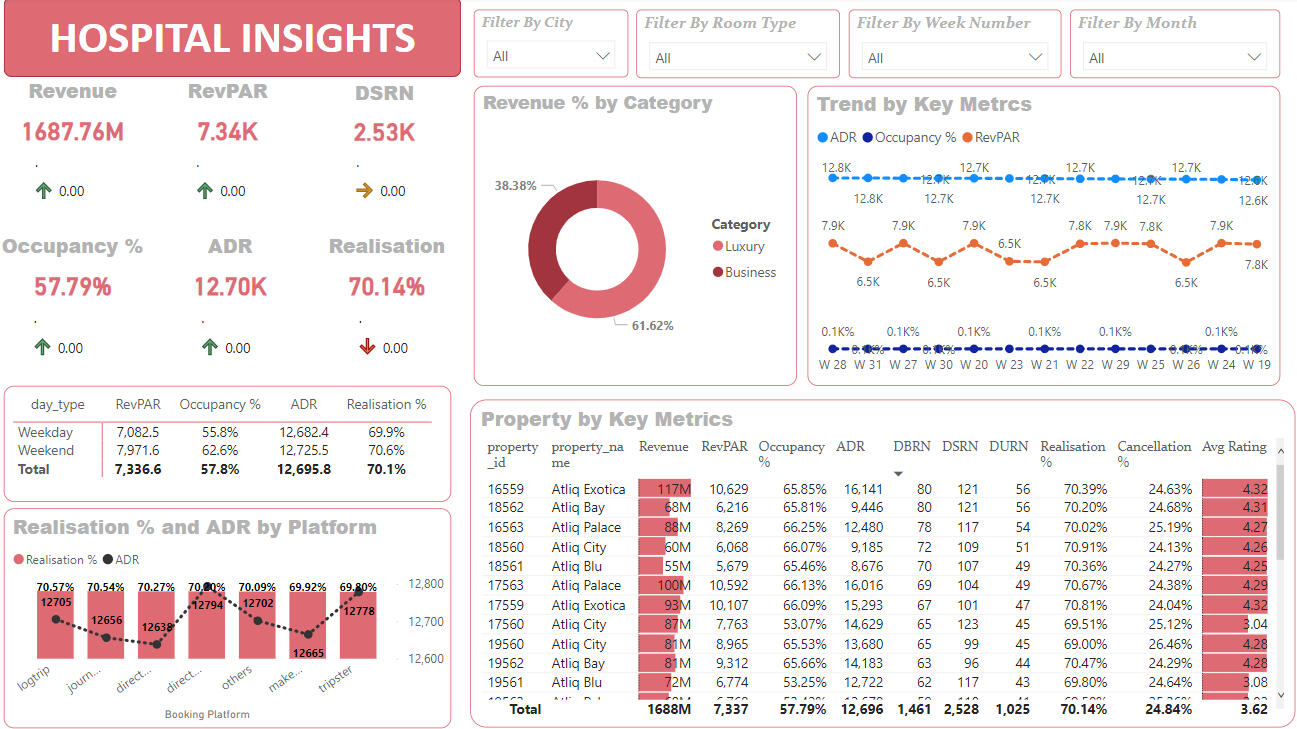
TextRevitalized Atliq Grand's market position by crafting a Power BI dashboard for deep analysis, utilizing Excel for data refinement, ultimately empowering the revenue team to foresee a potential 20% revenue and market share upswing.